Blog


Prancer cloud security platform provides end-to-end security solutions for the cloud. One of the main features of the Prancer platform is the unified reporting feature.
The unified reporting feature in the Prancer platform helps you find the test results with searching and filtering options. It also enables you to find false positives in your environment and exclude them for future runs.
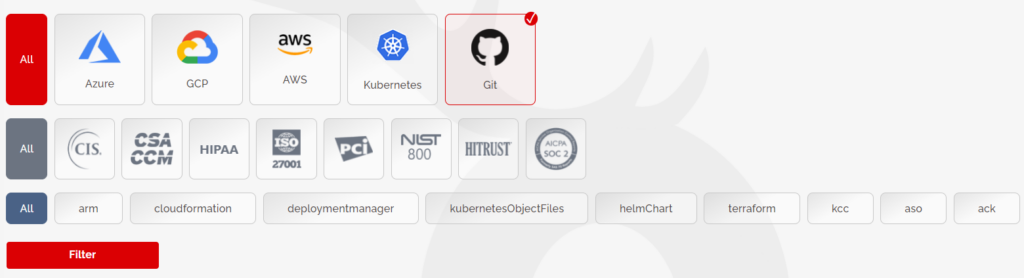
The “Report” page is available through the left pane. Click on the second link to browse the reporting page. There are different filtering features on this page, like the cloud technologies supported by the platform. The results can be filtered based on compliance too. Further filtering options are available in the last section based on the selection in the first section.
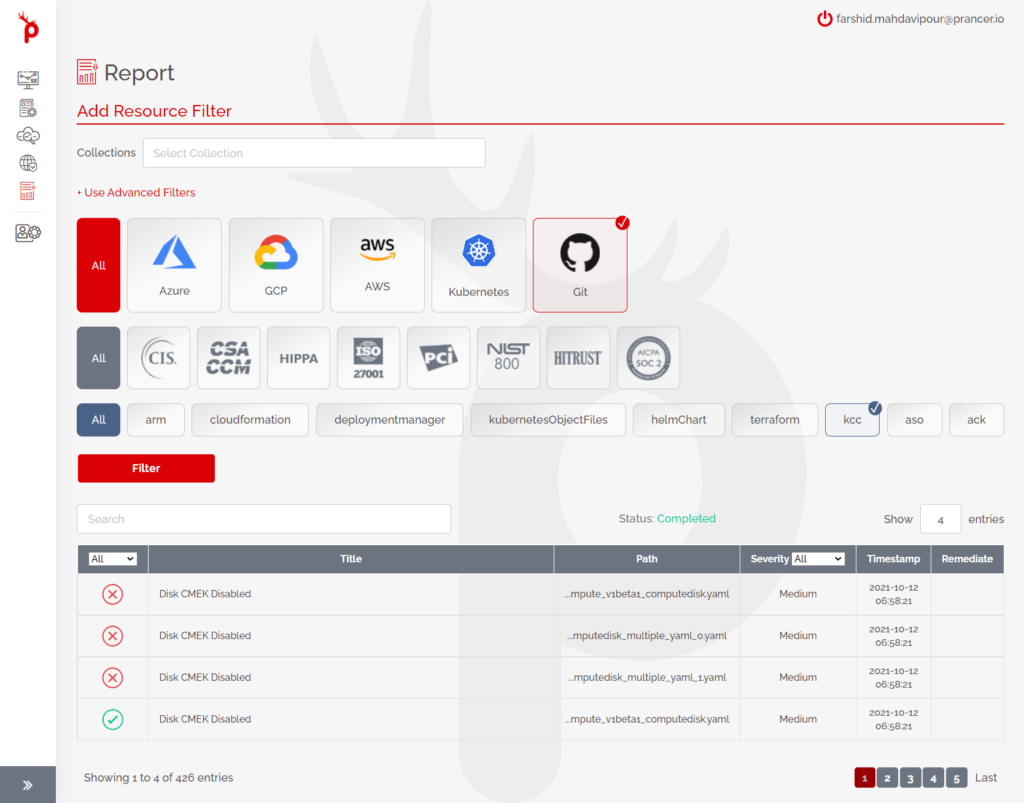
For example, suppose you want to see the result of the Infrastructure as Code (IaC) static code analysis for the Azure arm template. In that case, you can select the appropriate filters, which show you all the available test cases. The available test cases show you which have passed and failed based on the icons in the left column. You can see more details about each test case by clicking on that test case. The description also shows the link to the Git repository where the files are available and the GitHub where the source file is shown. You can also see the Snapshot available inside the Prancer platform when you click on the link.
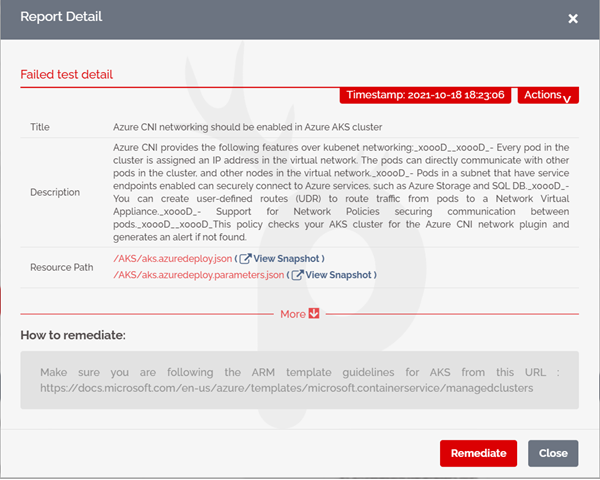
The link to Microsoft documents is provided in the “How to remediate” section because it is an Azure arm template. You can see more details like the compliance tests, the Rego rules, the logs, and other details. Any problems, if present, can be fixed from the Prancer interface with the help of the Remediate button. This option updates the environment, which is GitHub. This makes a pull request on behalf of the user, and clicking on the link shows you the fix for the problem and displays all the parameters that have been changed from their previous values.
The test results available in the list also apply to the other cloud resources and the Kubernetes environment. You have to click on which ones you wish to see, and the results will be filtered based on your selection. Different options are available, like collections, where different collections can be created based on different scenarios. So, this is a very flexible feature to name the test cases and the project you are working with.
The test results displayed are the latest run, but you can also go back in time to see a snapshot of how the environment looked like from a specific time in the past. For this function, you can use the advanced filters and specify the exact time you wish to go back to, the interval, and you can see the results based on the filters.
Other options to make it easier to work for you are the search bar and the severity filter, and how many entries to show on a page.
So, this Reporting feature is a powerful feature in the Prancer platform that can be used to get a better insight into your code and cloud live resources and fix the problems from this interface.