
Introduction
Resource Explorer is a compelling feature inside the Prancer Cloud Security platform to get an insight into what is happening in your environments. It can show you all the “Snapshots” stored in your database based on the cloud resources, and you can drill down and find out what the configurations are and all the test cases related to those cloud resources.
In this blog post, we will show you how to use Resource Explorer.
Using Resource Explorer
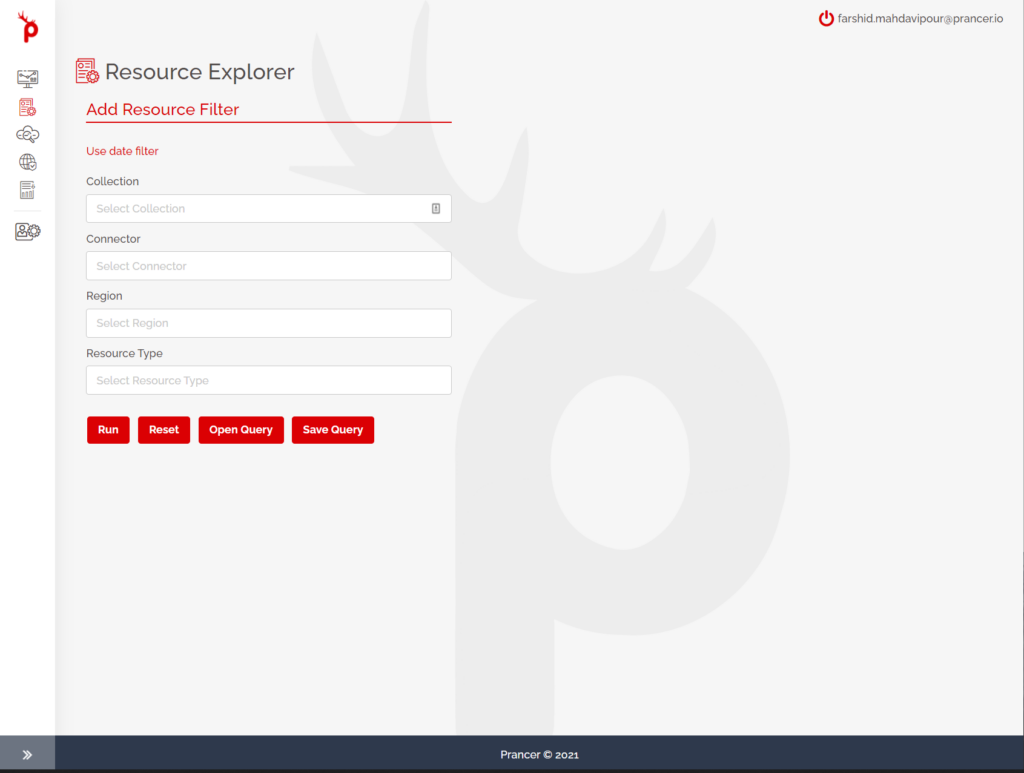
When you log in to the Prancer Cloud Security platform, you select the second tab from the left menu to load up the Resource Explorer page. Then, you need to choose some criteria for the filtering. First, you select the collection from the list of collections in the environment. Then, it will automatically fill out the filtering fields for you based on the collection that you have selected. You can change the preselected items in the dropdown list.
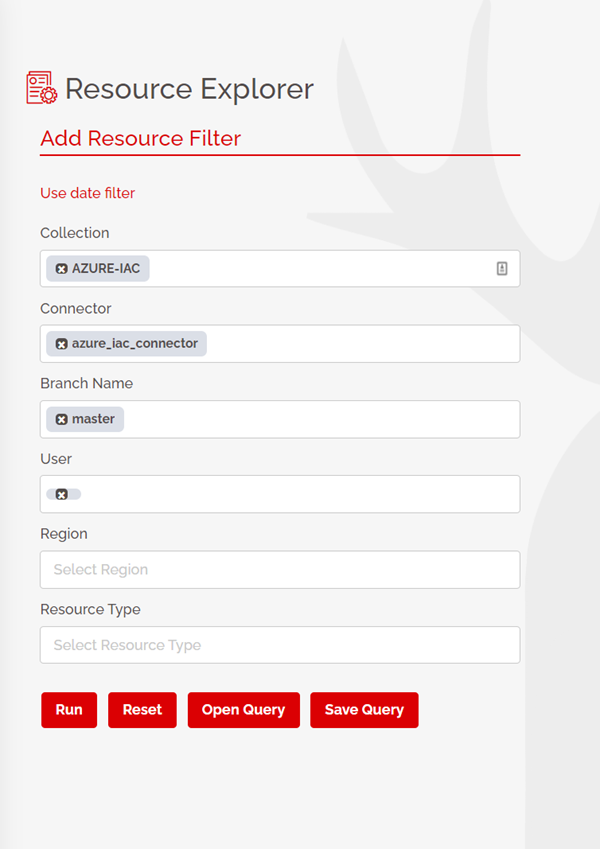
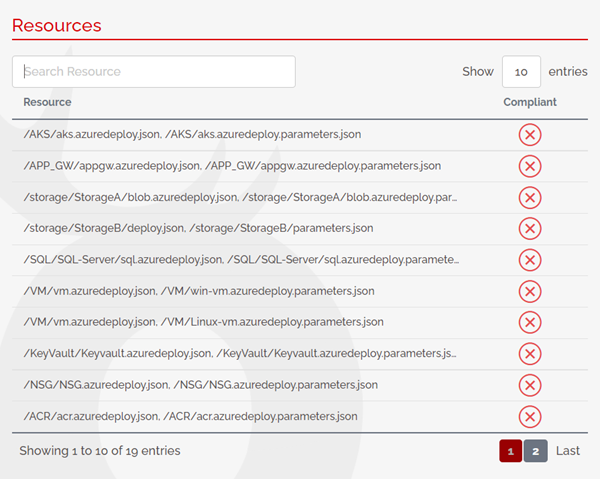
You can further filter the data that you want to get, for example, in the case of Azure, you can select a specific region or a specific resource type. When the filtering options are completed, you click on the “Run” button. The right side shows you all the related cloud resources and whether those resources based on the latest run are compliant or not.
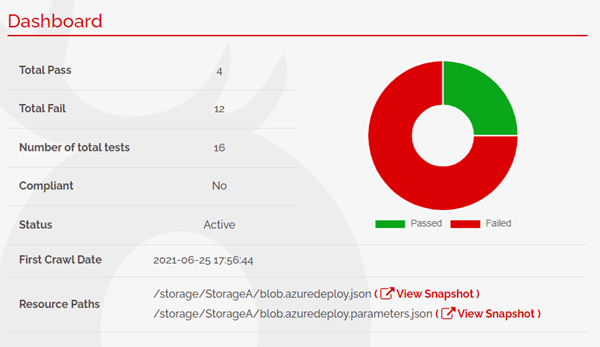
You can click on any specific resource to select them. Then, there is a simple dashboard that shows you the information on that particular resource. The total number of test cases on the resource and the total number of passed and failed test cases are the reports you can get from here. Also, there is a resource path that you can click on and see the snapshot of the resource in the JSON format.
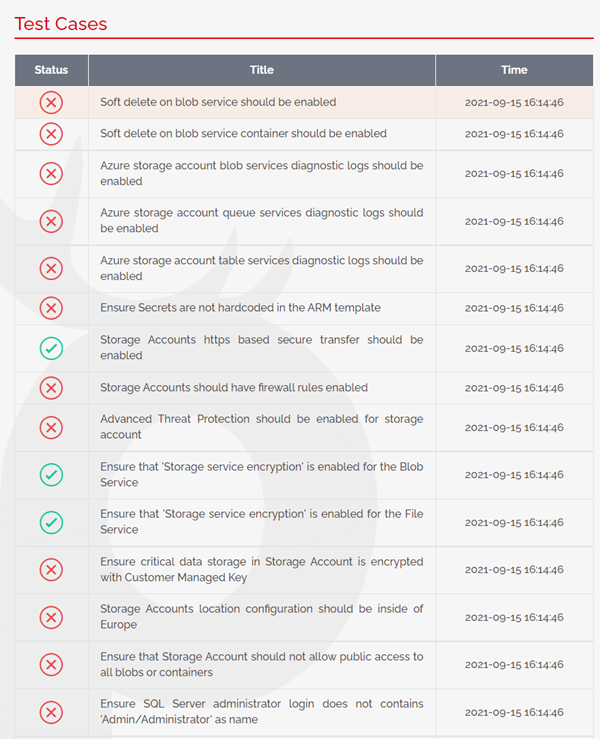
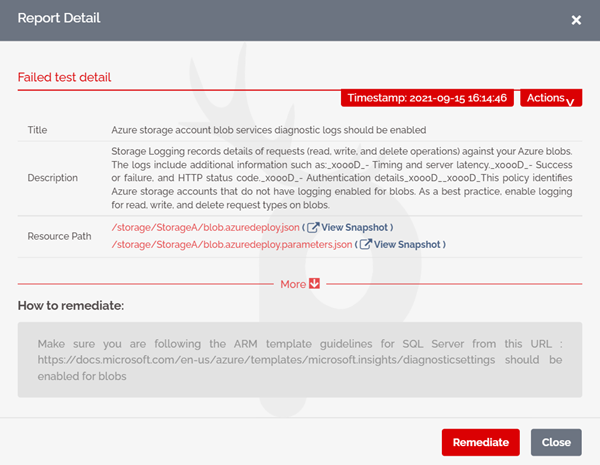
The next screen shows you all the test cases related to the selected resource, including the passed and failed test cases. On each line you get the information of one test case and whether it is passed or failed. When you click on one item, you see the detailed result of the test.
It is also possible to remediate the problem right here. You can click on the remediate button and if you are in the “monitor and remediate” mode, it will fix the resource in the target environment. in the case of Infrastructure as code (IaC) it fixes the code’s problem and pushes the code to the remote repo.
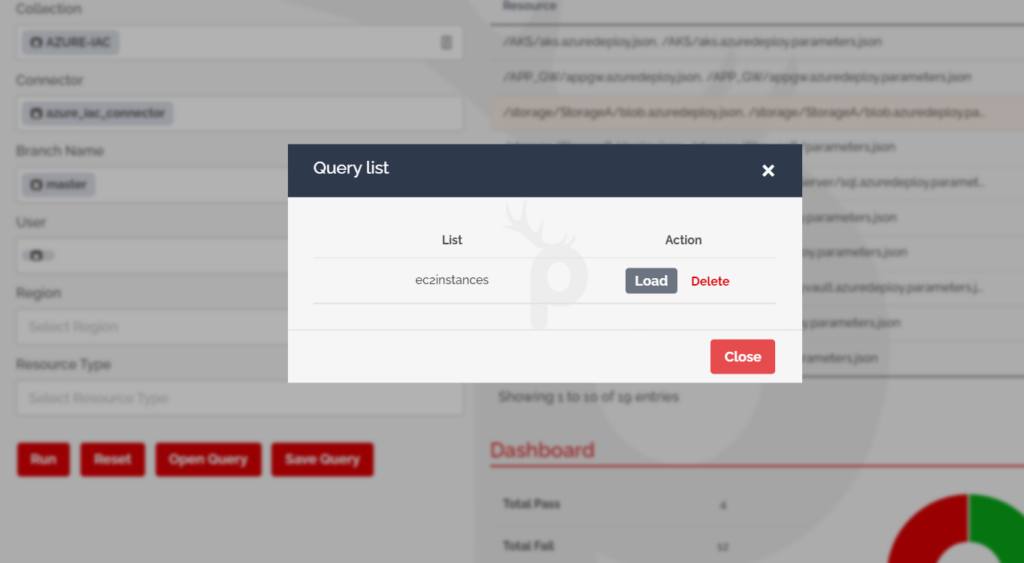
If you want to often come to the Resource Explorer page it makes sense to save the query and use it later. For example, if you have a specific region or a specific resource type that you are looking for, you can save it and every time, you can load the query and use that.
The “Resource Explorer” is a very powerful tool for you. You can use it to drill down into live cloud resources, the Kubernetes environment, and also to your Git repository to understand what is happening in those environments. Also, you can find out what are the test cases for each resource that you have in your environment and remediate those problems to fix the security misconfiguration in your cloud and your IaC code.